Retention
Part of Creator audience analytics that inform decisions
Reading follower gains alongside unfollows
Interpret follower gains and losses together, keep reporting scopes aligned and avoid mistaking net movement for an explanation.
Read gains and unfollows over the same period before interpreting a change in follower count. Net movement gives the direction of the balance. The two reported flows show whether that balance came from little movement or substantial movement both ways. Neither figure explains why anyone followed or left.
Align the reporting scope
Use the platform’s definitions and the same dates. Where it separately reports follows and unfollows for the same account and period, record both. If it shows only new followers and a total count, do not label the difference “unfollows”. Removals, adjustments and update timing may also affect the total.
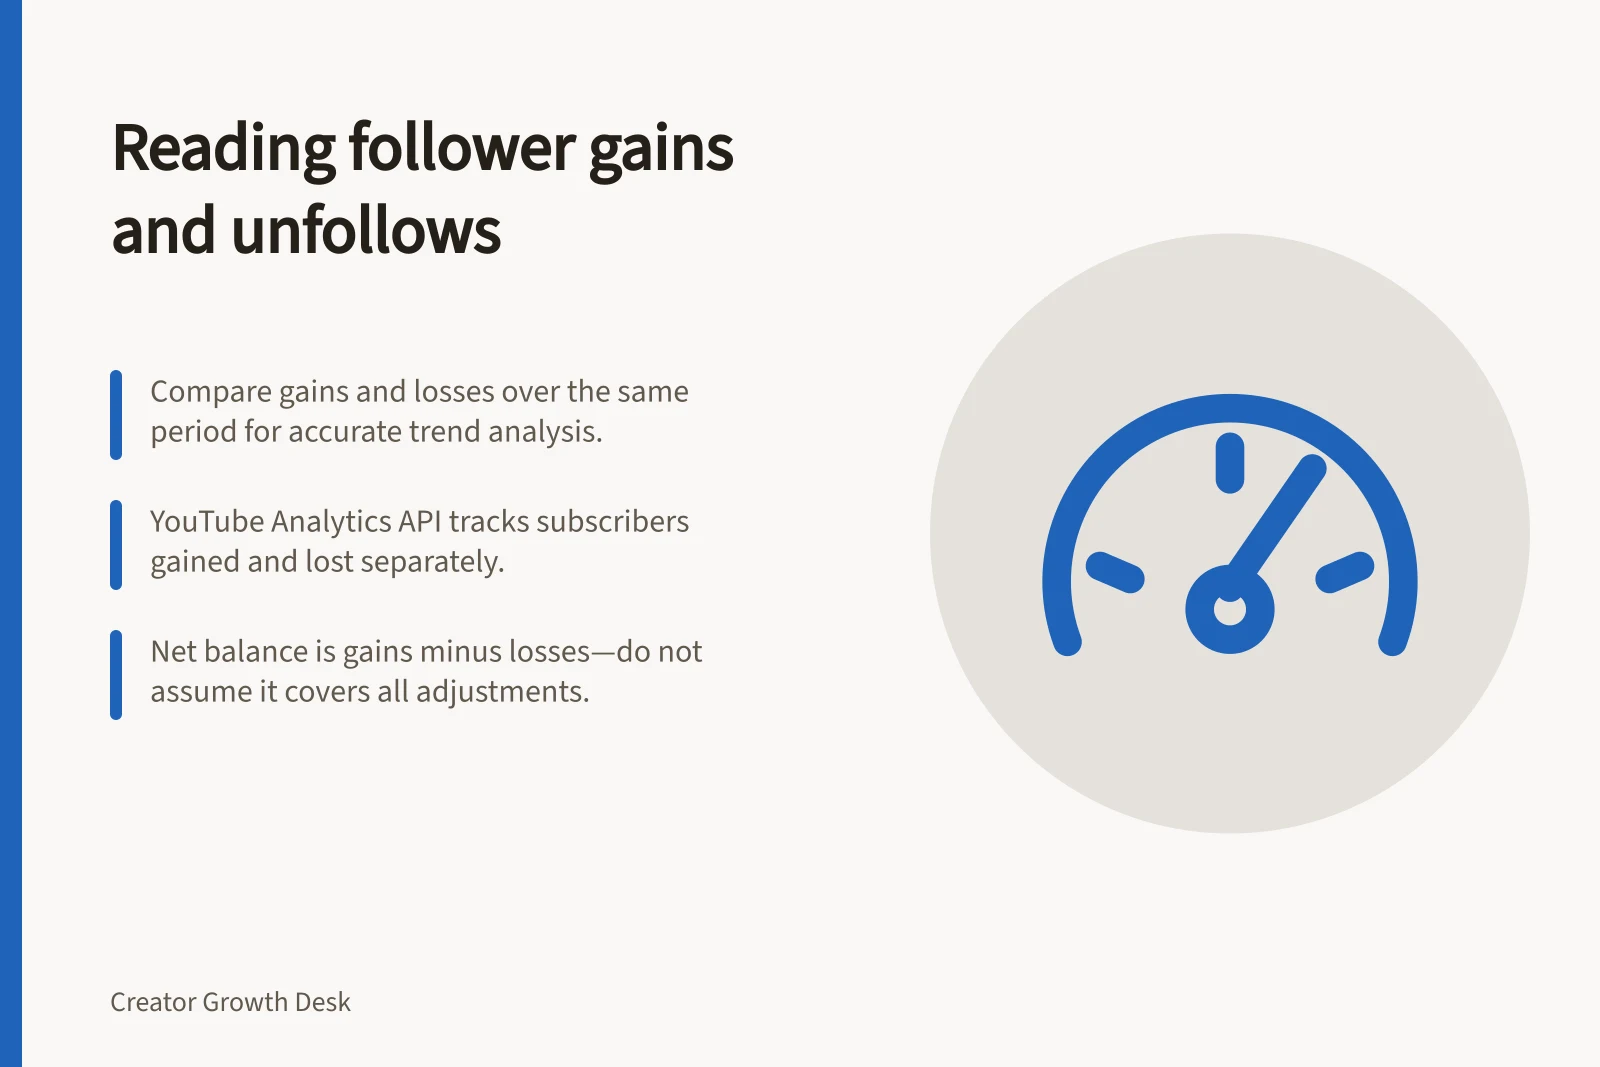
YouTube’s Analytics API lists subscribers gained and subscribers lost among its metrics. When examining movement, compare gains with losses for the same account and period.
For arithmetic, imagine 120 gains and 90 losses in one period. The balance of those reported flows is 30. Another period with 40 gains and 10 losses has the same balance but a different pattern. These are invented figures, not a creator result or benchmark.
The calculated balance should not be assumed to reconcile every adjustment to a displayed total.
Investigate the pattern
| Reported pattern | Question worth checking |
|---|---|
| Gains rise while losses stay similar | What introduced people, and does later work serve the same need? |
| Gains and losses both rise | Did the account reach a broader audience, or did other conditions change? |
| Gains stay similar while losses rise | Did topics, frequency or expectations change? |
| Both are small | Is the period too short for a topic decision? |
These are prompts, not diagnoses. A person may leave because a need ended or their interests changed; a dashboard does not identify their reason. Before changing direction, review the relevant publishing dates, entry pieces and later work.
Tracking Follower Trends Over Time
- 1Period : High Gains, Stable Losses — Growth in new audience; check entry content and audience needs
- 2Period : Rising Gains and Losses — Broader reach or changing conditions; review engagement patterns
- 3Period : Stable Gains, Rising Losses — Possible shift in content tone, frequency, or expectations
- 4Period : Low Gains and Low Losses — Short period may not reflect long-term decisions; consider time frame
Pair movement with continued use
A follower may never return; a non-follower may use several pieces.
If gains rise, inspect interest in relevant later work. If losses rise, first check for an obvious reporting explanation, then review whether recent work kept its audience promise. Neither step proves causation.
Finish with a bounded note: “For these dates and this reporting scope, gains were X and losses were Y; their balance was Z. We also changed A. We will check B next.” If comparable gains and losses are unavailable, record that limit instead of estimating unfollows from a net count.
Key Metrics for Follower Analysis
- Follower Gains
- X
- Unfollows (Losses)
- Y
- Net Balance
- Z
- Action Taken
- We changed A
- Next Check
- We will check B

![Check if packaging reaches your intended audience: This piece is for [person in a situation] who needs [decision] and delivers [answer].; Compare the routes into the video before interpreting a rate.; If the title or image suggests the wrong task, make that element more exact. Checking whether packaging attracts the intended audience](/covers/checking-whether-packaging-attracts-the-intended-audience-640.webp?v=114adaa3)