Creator Analytics
Part of Creator audience analytics that inform decisions
Comparing content by audience stage rather than raw views
Compare creator content by its job for new, current or returning viewers while keeping metric definitions and reporting windows in view.
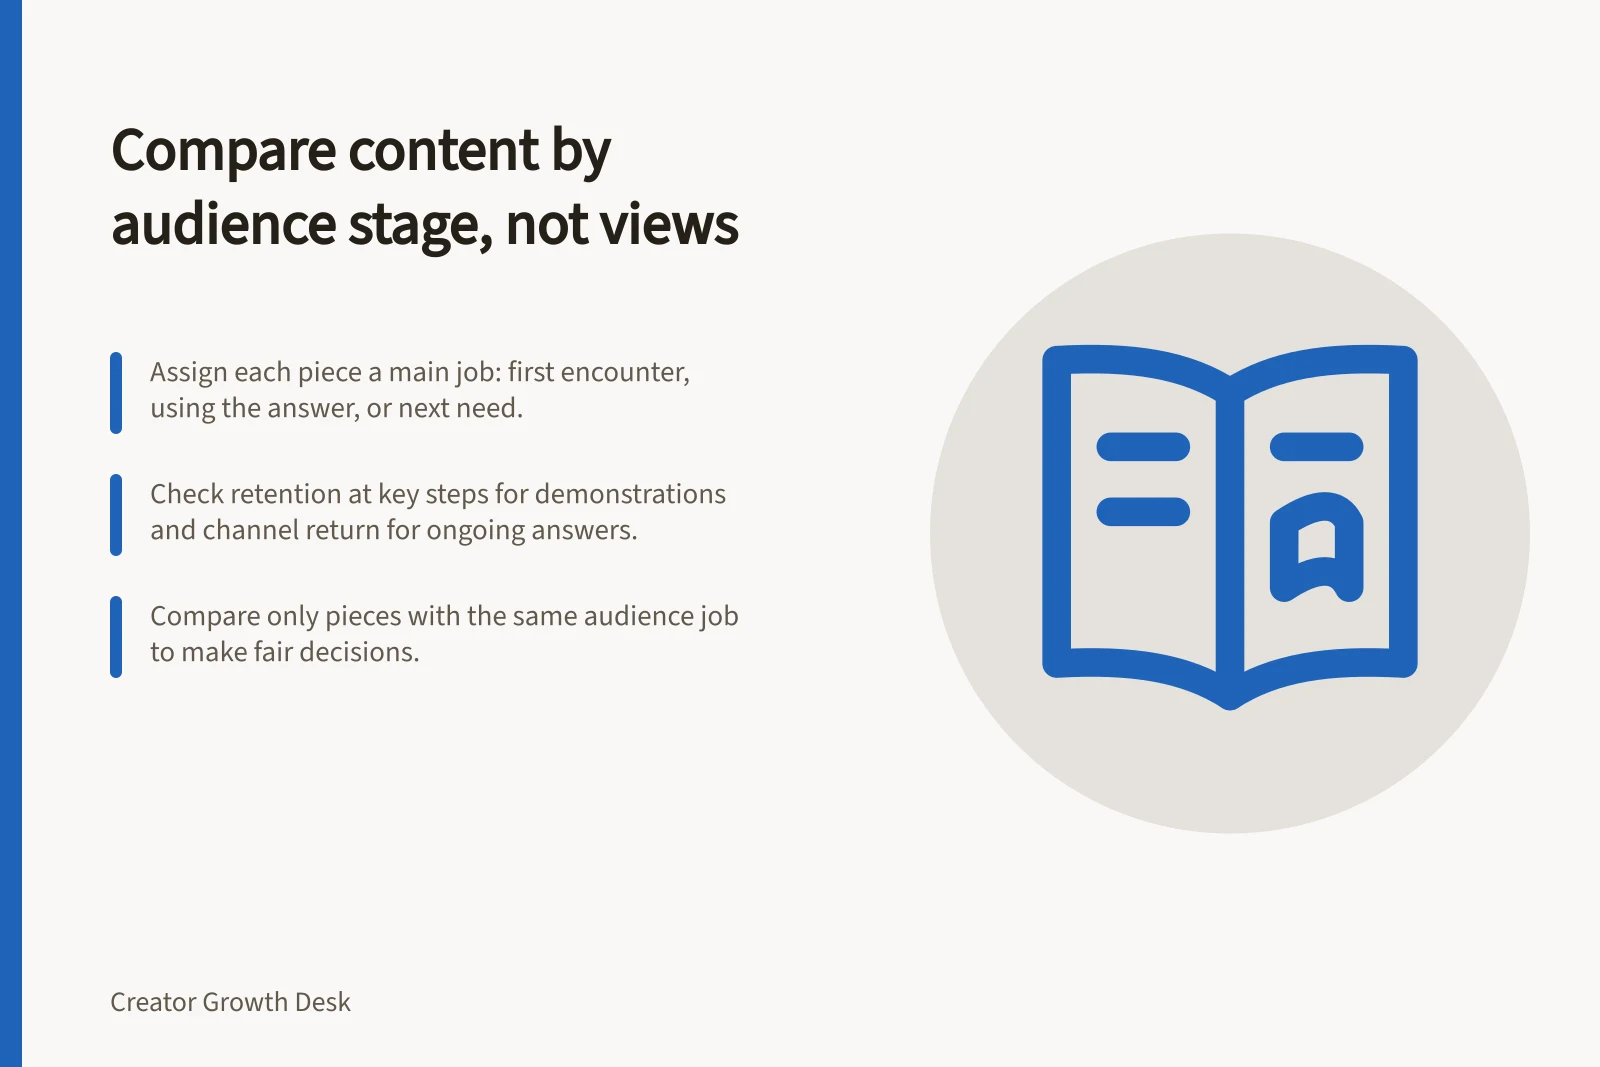
Compare pieces by the audience job they were made to serve. An introduction, a worked answer and a follow-up each create different opportunities to earn views. Assign each piece’s main job before opening the report, then compare it with pieces doing a similar job.
Assign the job before seeing the result
Classify a piece by the intended viewer task, not the eventual view count. Otherwise a popular post can be relabelled a “discovery” piece after the fact, even if it was made for existing followers.
| Audience job | What the piece should do | Review question |
|---|---|---|
| First encounter | Answer a question understandable without knowing the creator | Did relevant newcomers appear to find and choose it? |
| Using the answer | Explain or show the necessary step | Did the piece reach the step that fulfils its promise? |
| Next need | Answer a related question after the first is complete | Is there visible interest in related work over time? |
These are editorial categories, not platform labels. One piece may serve more than one job. Name its main job and note a second only if that changes the comparison.
Match the measure to the job
For a YouTube discovery piece, traffic sources and new-viewer context can help assess arrival. Check YouTube’s definitions and reporting windows before interpreting audience categories or analytics reports; “new” does not prove the topic itself was new to them.
For a demonstration, inspect the video-level retention report at the essential passage. For a continuing answer, examine relevant later work and channel return over time.
These aggregate reports do not show that a particular viewer followed the whole sequence. Do not divide a channel’s returning viewers by one video’s views and call it a return rate: those measures describe different populations.
Key Metrics by Content Job
- Discovery Piece Metric
- Traffic sources & new-viewer context
- Demonstration Metric
- Video-level retention report at essential passage
- Continuing Answer Metric
- Relevant later work & channel return over time
Make the comparison answer a decision
Imagine a widely viewed introduction to a balcony setup and a quieter piece explaining one maintenance choice. The first may introduce the subject; the second may help people already trying the task. Their raw totals cannot establish which question should come next.
Compare the introduction with other introductions and the focused answer with other focused answers. Check whether each title named its intended question and each piece delivered it.
If the quieter piece received specific next-step questions, one may deserve an answer. If few people encountered it, investigate discovery before judging the underlying task.
Conclude in terms of the assigned job: what the piece appeared to introduce, explain or extend. When evidence is thin, name the further check rather than declaring the largest view total the winner.