Creator Analytics
Part of Reaching Australian audiences as a creator
Measuring the share of views from the intended market
Calculate the share of YouTube views attributed to Australia using matching geography and total-view figures, then check missing rows and measurement limits.
First decide whether you mean the share of views, watch time or distinct people from a market. They are different measures.
For an Australian view share, divide views attributed to Australia by total views for the same content and date range. Label the result “share of views from Australia”, not “share of Australian viewers”. Check for limited geography rows before interpreting it.
Set a market the report can show
A YouTube country breakdown shows what share of reported views came from Australia. It cannot isolate an Australian city or community from the country row. Location reporting covers where viewing was attributed; it does not establish a viewer’s residence, identity, language or reason for watching.
Choose a video, a defined group of related videos or the channel. Record the date range and metric. A share for one regional tutorial is not directly comparable with a channel share that includes unrelated international topics.
Calculate a like-for-like share
Use the Australian row as the numerator and total views for that same selection as the denominator. Make sure the metric you use matches the question: a view-share calculation needs views, not a watch-time ranking.
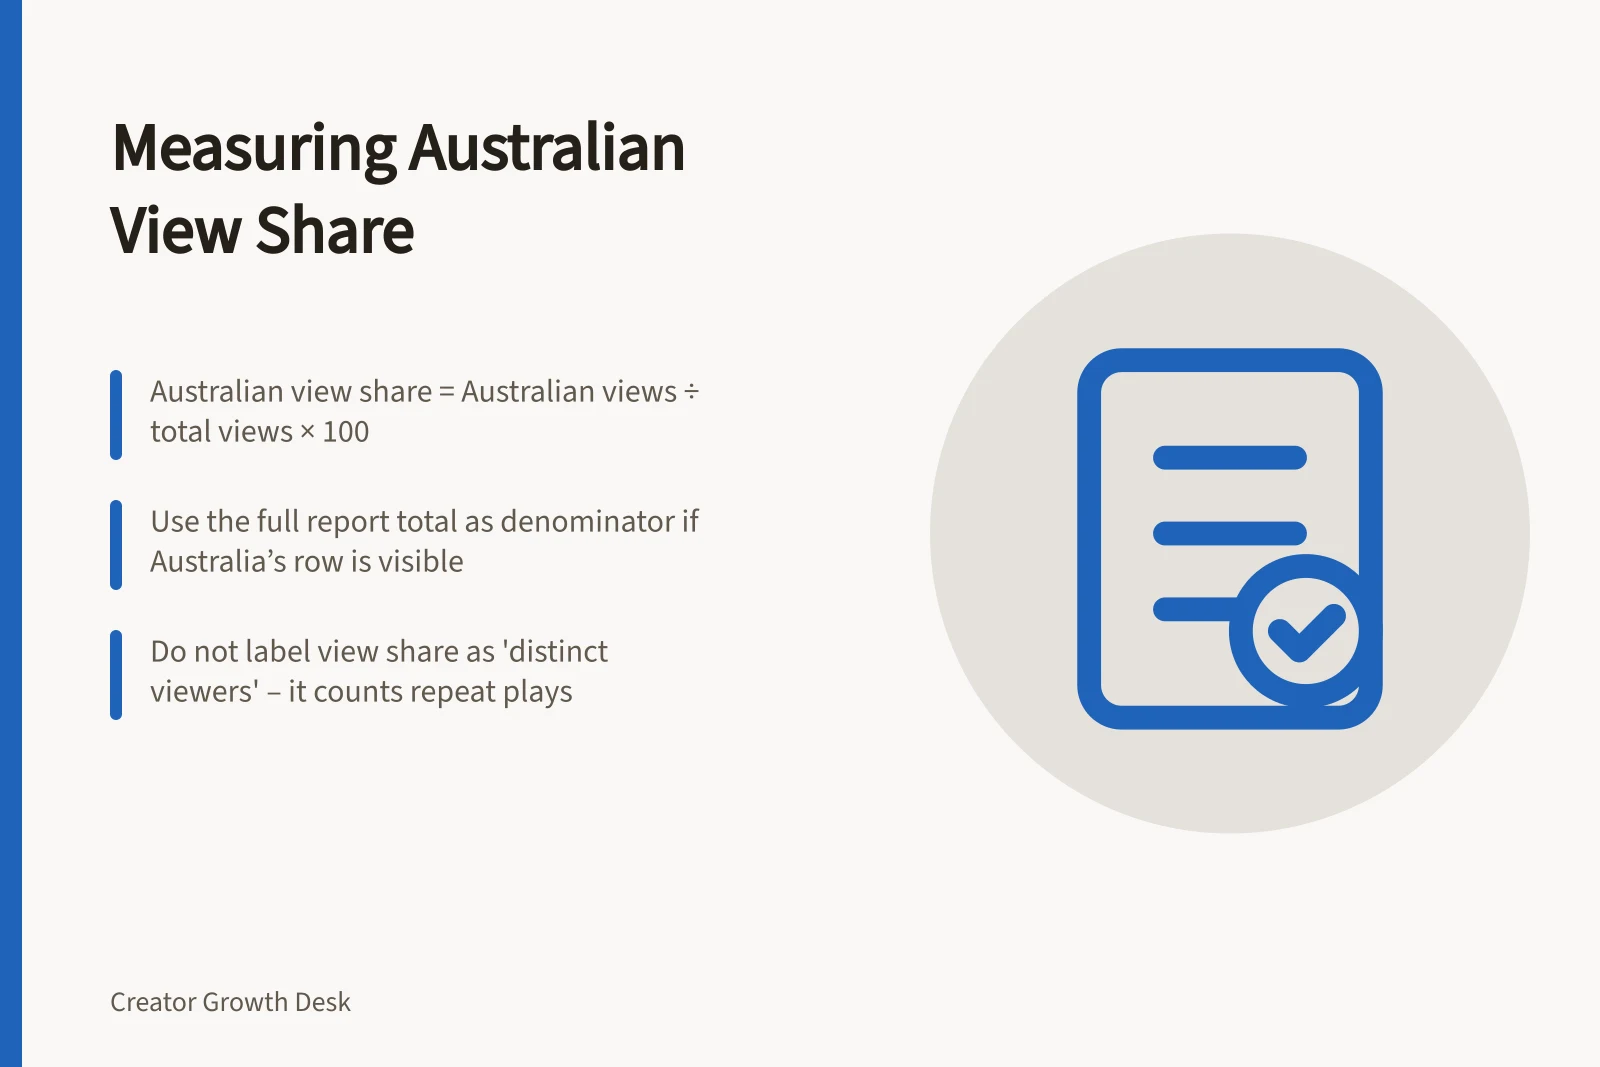
Australian view share = Australian views ÷ total views × 100
The percentage describes views, including repeat plays. It does not describe the share of distinct viewers who live in Australia. If the intended question is about watch time, divide Australian watch time by total watch time for the same selection and label the result accordingly.
Steps to Accurately Measure Australian View Share
- Choose the correct content set (video, playlist, or channel)
- Define a consistent date range
- Use Australian views as numerator and total views as denominator
- Ensure metric matches the question (e.g., views for view share)
- Do not rename view share as 'distinct viewers' or 'audience share'
View Share vs Watch Time Share: Key Differences
- View Share
- Counts all views, including repeat plays. Use when measuring reach or popularity.
- Watch Time Share
- Measures total minutes watched by audience in Australia. Better for engagement analysis.
Check for limited geography data
Geography data can be limited. If Australia’s row is visible, use the report total as the denominator rather than summing only the displayed country rows. Adding only displayed rows would inflate the share.
If Australia’s row is absent, do not treat it as zero or claim a precise Australian share from the visible rows.
A longer period or broader content set may reveal more rows if that wider selection still answers your question. Record any change to the selection.
If you need a share of distinct people, first confirm that the platform provides compatible geography and unique-viewer figures for the same population and period. Do not rename a view-share result as a people-share result.
Pros and Cons of Using Geography Data in YouTube Analytics
- ProsShows where viewing was attributed; useful for regional content targeting in Australia.
- ConsCannot confirm viewer residence, language, or intent; limited geography rows may lead to misinterpretation.
When to Reassess Geography Data Availability
- If Australia row is missingDo not assume zero share; consider extending date range or broadening content set.
- If only partial data is visibleUse report total as denominator, not sum of displayed rows, to avoid inflation.
- After changes in content or promotionRe-evaluate share trends with new uploads, collaborations, or paid campaigns.
Compare without assigning a cause
Keep the content set, metric and reporting window comparable. Record new uploads, collaborations, paid promotion or an unusually broad topic that may change the mix.
An increasing Australian view share can coincide with fewer Australian views if views elsewhere fall faster; read the numerator and denominator alongside the percentage.
The report can show where measured viewing was attributed. It cannot establish whether those viewers had the intended need or whether a local reference caused them to watch.
Inspect the pieces and any relevant questions viewers ask. When data is limited, report the limit and make a smaller editorial decision, such as clarifying a location claim or gathering more comparable work.