Retention
Understanding audience retention in creator content
Understand what video audience retention reveals, where it can mislead, and how to read it alongside return behaviour.
Audience retention describes how much of a video people continue to watch and where they stop or skip. It helps you inspect whether the video delivers its promised answer.
Returning viewers answer a separate question: whether people come back to the channel. Read both in context before changing what you make.
Other content formats may offer different engagement measures, so a video retention percentage is not a universal score for creator content. Start with what the piece was meant to help someone do, then choose a measure that can reveal where that help succeeds or breaks down.
Ask what you need to learn
| Editorial question | Useful signal | What it cannot tell you alone |
|---|---|---|
| Did the opening earn attention? | The percentage of viewers still watching after the first 30 seconds | Why a particular person left |
| Did the explanation hold together? | The shape of a video's retention curve | Whether a dip means confusion, skipping or a completed answer |
| Was the length justified? | Average viewing time and percentage viewed, read together | A universally correct length |
| Do people want more from this creator? | Return behaviour over time | Whether one upload caused someone to return |
What audience retention can and cannot tell you
- ProsIdentifies where viewers drop off; reveals if opening grabbed attention; shows whether explanation held together
- ConsDoes not explain why someone left; cannot confirm if a dip is due to confusion, skipping or completion; not a universal measure across formats
Inspect the viewing pattern
YouTube's audience retention report applies to an individual video. Videos generally taper off during playback. A dip marks a part people skipped or where they stopped watching; a spike can reflect replay or sharing.
Replay may also mean an explanation was unclear. The chart points to a moment to inspect, not its cause. Highlighted moments are shown only when detected.
Watch the finished video around a noticeable change. Did the opening set the right expectation? Was a necessary step missing?
Did an aside interrupt the demonstration, or had the viewer already received the answer? Comments may offer clues, but commenters represent only some viewers.
Tie a proposed edit to what you find. A slow opening may benefit from stating the question earlier.
A drop before an important result may justify moving the demonstration forward. If the answer is complete before the video ends, consider trimming the ending rather than withholding the answer.
Actionable steps after reviewing retention data
- Watch video around retention dipsCheck if opening matched title/thumbnail expectations
- Evaluate clarity of explanationLook for missing steps or interruptions in demonstration
- Review comments for feedbackUse comments as supplementary insight, but note they represent only part of the audience
- Plan edits based on findingsAdjust timing, structure or content to improve engagement
Use the report as a checkpoint
In YouTube Studio, open Content, select a video, choose Analytics, then find Audience retention under Overview or Engagement.
The report is available at the individual-video level, and its data typically takes 1–2 days to process, so avoid treating a very recent upload's chart as complete.
Use the chart to locate a moment, then check the video itself before deciding what to change. A flat line means viewers watched that part from start to finish; a gradual decline means attention fell over time.
Key audience retention metrics in YouTube Studio
- Data processing delay
- 1–2 days
- Audience retention chart availability
- Individual video level only
- Regular viewer threshold
- Monthly viewing for >6 months in past year
How to use the audience retention report in YouTube Studio
- Access Content sectionGo to YouTube Studio > Content
- Select a videoChoose the video you want to analyse
- Open AnalyticsNavigate to Analytics > Overview or Engagement
- Review Audience retentionCheck the retention curve for drops, spikes and flat lines
- Watch video around key momentsReplay sections with retention dips to assess clarity or pacing
Read high-attention moments carefully
YouTube's intro measure shows what percentage of the audience was still watching after the first 30 seconds.
A strong result may indicate that the opening matched the expectation set by the title and thumbnail, or that it held viewers' interest; it does not identify which explanation applies.
Top moments are sections where almost no one dropped off.
If one appears later in the video, consider whether its compelling material could be introduced earlier, since audience size typically decreases through playback. A strong section can also suggest a subject worth exploring in newer content.
Top moments in audience retention: what they suggest
- Top moment early in videoStrong opening matches title/thumbnail; sets correct expectation
- Top moment later in videoCompelling content may be better placed earlier; consider reordering for impact
- Multiple top momentsHighly engaging segments may indicate topics worth exploring in future content
Compare similar work
Length, format, topic and traffic source affect comparisons. YouTube offers a typical-retention view for recent videos of similar length and a broader comparison with videos of similar length.
Advanced Mode can compare videos, groups and time periods. These views provide context; they do not decide whether the content was useful.
Compare uploads after a similar amount of time live. Note a collaboration, promotion or unusually broad topic that may have changed who arrived. Where viewer segments are available, check whether groups watched differently.
When comparing, check that the viewer segment, traffic source and date range are similar; otherwise, apparent differences may reflect who watched rather than the edit.
Comparing audience retention across similar videos
- Traffic source
- Search and suggested videos
- Viewer segment
- New viewers (first-time visitors)
- Date range
- Last 30 days
Keep return behaviour separate
YouTube reports new, casual and regular viewers in its channel audience measures.
Its regular-viewer category requires monthly viewing for more than six months in the past year, so it cannot give an immediate verdict on a new series. Subscriber count is also a poor substitute for the number of people currently watching.
Record one observation, a plausible explanation and one change to try in a future piece. Then review that piece alongside comparable work and the question it was meant to answer.
YouTube's monthly audience is the total number of unique viewers who watched channel content in the last 28 days. Its new-viewer category can include people who have not watched the channel for over a year, as well as people watching in a private browser or with deleted watch history.
In this guide
- Reading where viewers leave a videoFind a video retention dip, inspect the passage and choose a useful edit without assuming the chart explains why viewers left.
- Comparing repeat viewers with one-time reachCompare reach, first-time viewing and return with consistent reporting windows, without treating views or subscribers as people.
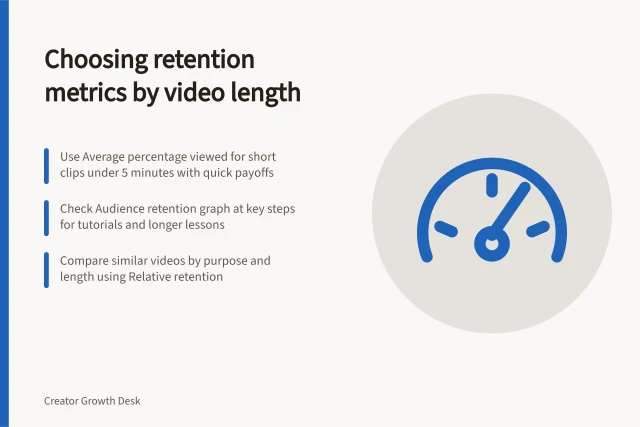
- Choosing a retention metric for different content lengthsChoose retention measures for short clips, tutorials and longer videos while keeping viewing time, percentage and early exits in context.
![Check if packaging reaches your intended audience: This piece is for [person in a situation] who needs [decision] and delivers [answer].; Compare the routes into the video before interpreting a rate.; If the title or image suggests the wrong task, make that element more exact. Checking whether packaging attracts the intended audience](/covers/checking-whether-packaging-attracts-the-intended-audience-640.webp?v=114adaa3)